
LabPlot
#LabPlot is a FREE, #opensource and cross-platform data #visualization and #analysis software accessible to everyone and trusted by professionals.
• High-quality interactive plotting
• Reliable data analysis, statistics, regression, curve and peak fitting
• Computing with interactive Notebooks (Python R Maxima Octave and more)
• Data extraction from plots and support for live data
• Data import and export (many file formats)
• Runs on Windows, macOS, Linux
Partly funded through #NGI Zero Core.
- 8 Posts
- 5 Comments
It depends on the expected functionality. You can check the existing features here:
➡️ https://labplot.org/featuresWe are currently working on expanding #LabPlot’s functionality in these areas:
▶️ Live Data Analysis
▶️ #Python Scripting
▶️ Statistical Analysis
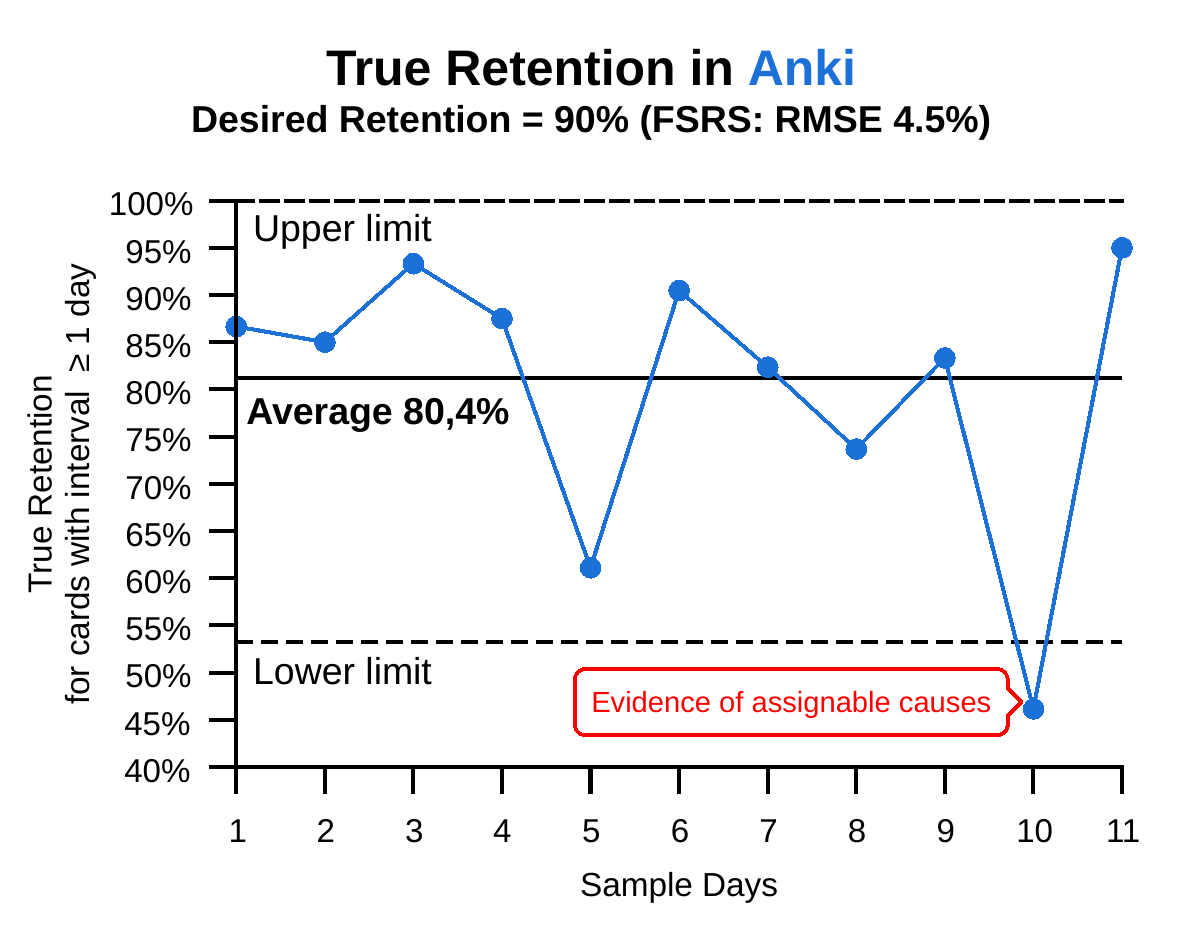
▶️ Quality Improvement Charts
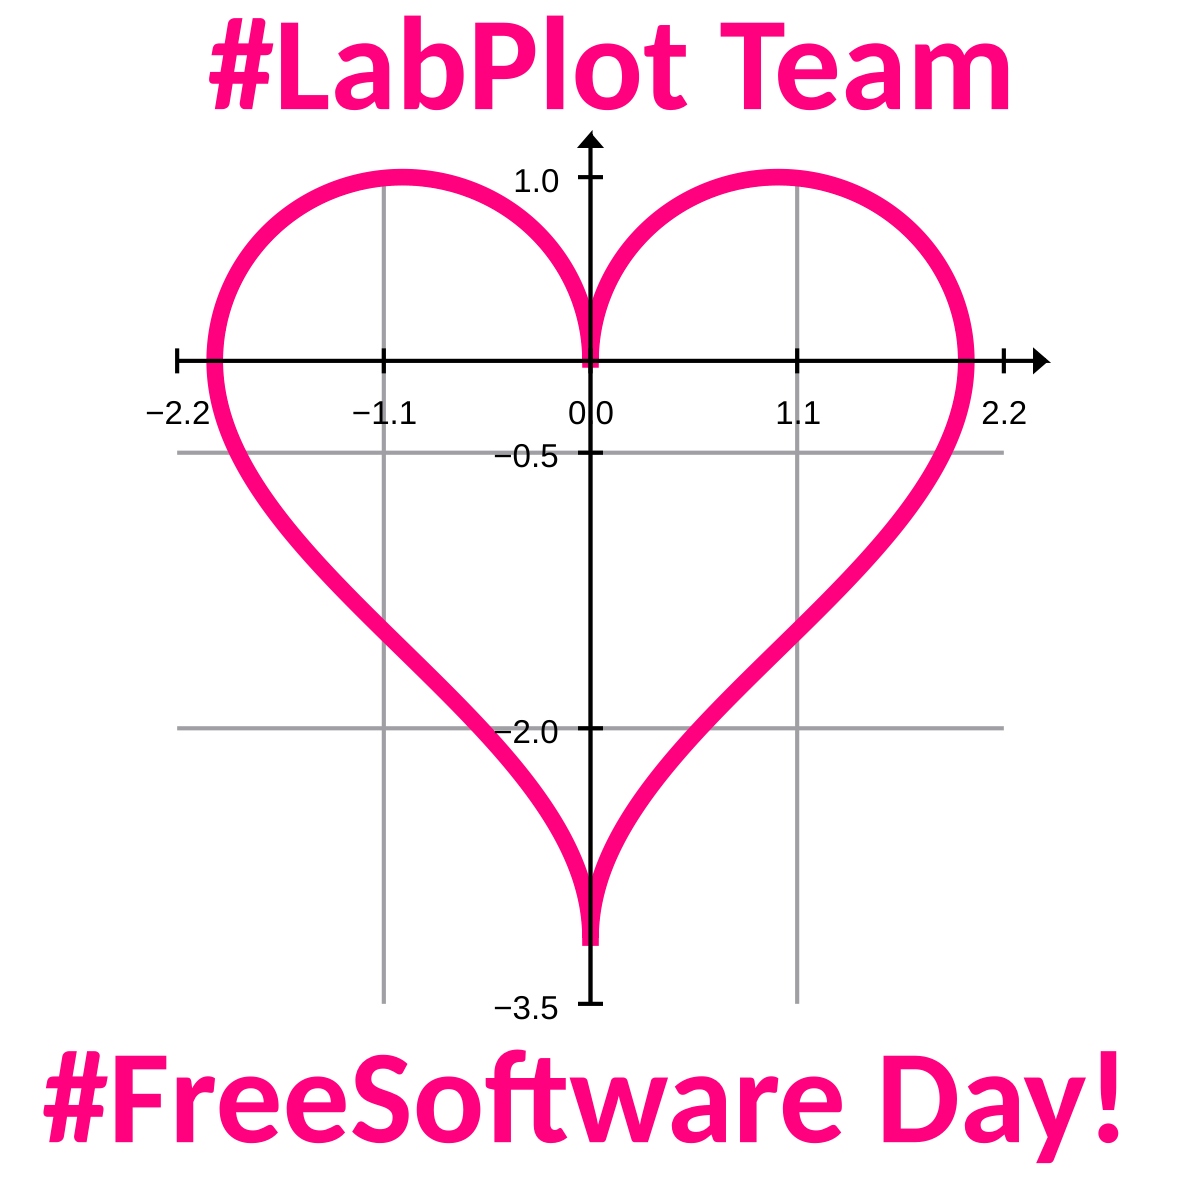
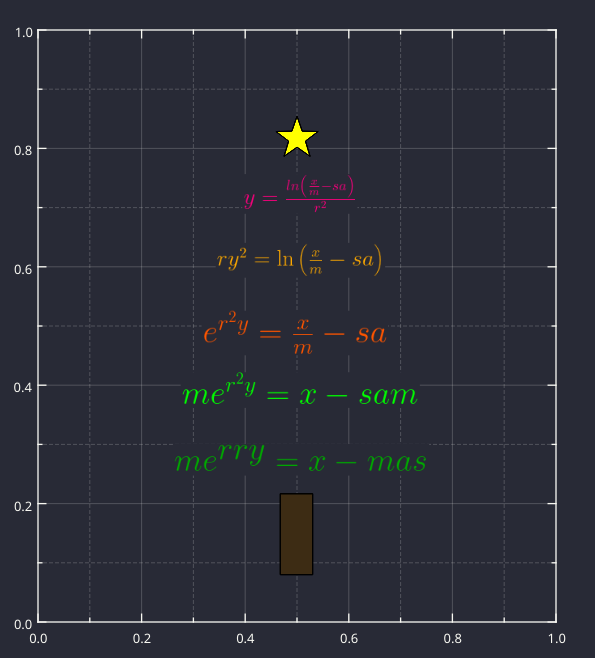
Our Christmas tree includes a test to check if our readers are humans 😉
Let’s just assume that the Christmas tree includes a test to check if our readers are humans 🙂
@IrritableOcelot
Thank you for your feedback. Have a look at LabPlot’s features, esp. the section on data analysis and statistics. More to come soon.
➡️ https://labplot.org/features